For many sales leaders, decisions are made based on data and analytics. In a world increasingly based on data and numbers, it only makes sense to base your path ahead on factual information. It would be difficult to find a sales manager that doesn’t base next steps on what’s going on right now and what the data leads them to. However, not every manager fully knows which metrics are the best guide to make adjustments that will move the needle. There’s a plethora of prospecting metrics available and this post will help show you the ones that can create actionable insights and drive best practices moving forward.
Why Should You Track Prospecting Metrics?
As mentioned above, sales managers across the world track metrics. While the amount and type may change from organization to organization, everyone has an interest in leveraging data. For many, prospecting metrics are the standard KPIs you would think of. Open rates, click rates, phone calls made, emails sent, and so on. However, there’s many more possibilities to track the success of your prospecting efforts.
Tracking metrics is how you gain visibility into what’s working and what’s not working. Yes, while we would all love to trust our salespeople to be 100% honest about how their prospecting is going, it’s more reliable and easier to have technology that tracks their efforts for you. From here, you can see the health of your efforts, which helps plan ahead.
For example, knowing a certain email or call script isn’t getting any responses is a great indicator that you need to change it up. Or, if one of those is getting very good response rates, you may want to implement it across your whole team.
Types of Prospecting Metrics
As with anything, you can find many ways to track prospecting success. Below there are some categories of metrics that will certainly help you find the right direction for your team.
SaaS Marketing Metrics
Some of the marketing metrics surrounding this can be crucial in seeing big picture trends. For example, these include data points such as customer acquisition cost, annual contract value, net promoter score and churn rate. While these may not impact your sellers in their day-to-day work, they certainly play an impact on how you prospect moving forward.
SaaS Sales Metrics
Similarly to SaaS marketing metrics, SaaS sales metrics follow the same big picture idea, with some overlap. This is where you’ll find your lead-to-close rate, conversion rate, average new account value and customer lifetime value metrics. While the metrics above deal more with gaining customers, these ones deal with closing deals and how successful your team is at accomplishing this.
B2B Sales Metrics
B2B sales metrics are ones that deal with how well your sellers are reaching other businesses, hence the B2B. It’s important not only to track the outcomes of your prospecting efforts, but also what went into efforts as well. For example, this is where you’ll track things like average lead response time, lead-to-opportunity ratio and new leads by source.
KPIs for Sales and Marketing
There are so many KPIs to track in the sales world. These key performance indicators are so widespread because there’s such a wide array of ideas on what can help drive growth. Everything from email success metrics to revenue metrics can fit under the umbrella term of KPIs. If one manager believes one thing will drive success, this would make tracking it a KPI for their company, while another may not think this metric is important to their team. Some common sales KPIs include number of calls, positive vs. negative reply rates and cost per lead.
How Do You Track Metrics Properly?
Once you go through and determine what metrics are most important to track for your company and team, the next step would be to set up a way to track all of them effectively. A very common way would be through analytics and reporting. Oftentimes these are visualized as graphs, charts, diagrams, and so on. For many sales leaders, there’s important meetings and calls taking up a majority of the day, so being able to see all the most important metrics tracked in an easy to digest system is very important.
For many teams, the way to build reports is through Salesforce. Those that store customer data within Salesforce and use it in their sales process can build reports within Salesforce. Many teams also show this information using a sales dashboard within Salesforce. However, this may cause some issues. For those teams also using software outside of Salesforce, there’s sometimes issues with having consistent reporting. For example, many times non-native sales engagement platforms, which track sales prospecting metrics, don’t align with Salesforce reports that are supposed to show the same thing.
What Metrics Are Most Important?
With so many possibilities as to what metrics should be considered KPIs and tracked, it’s easy to get bogged down and not sure what to focus on. Here as Salesvue, we have our own ideas about the metrics that matter. We try to help our customers go beyond vanity metrics and gain insight into what is actually driving results. A big part of how we accomplish this is with our Math of Sales reporting.
Math of Sales
Math of Sales is Salesvue’s way of displaying the analytics that truly make an impact on your business, and the data points that you should base your next steps on. To put it simply, the Math of Sales reports show the effort it takes to find success in a specific area. For example, you can see the number of touches it takes to have a conversation, and then the number of conversations it takes to close a deal. While this seems great on its own, we take it a step further.
Through these reports, you can base this logic on any Salesforce object or field. So, you can see these ratios across industries, individual sellers, days of the week, lead source, job titles you’re targeting, and more. This helps sales managers focus efforts and dig deeper into what’s working and what’s not. Here’s an example below.
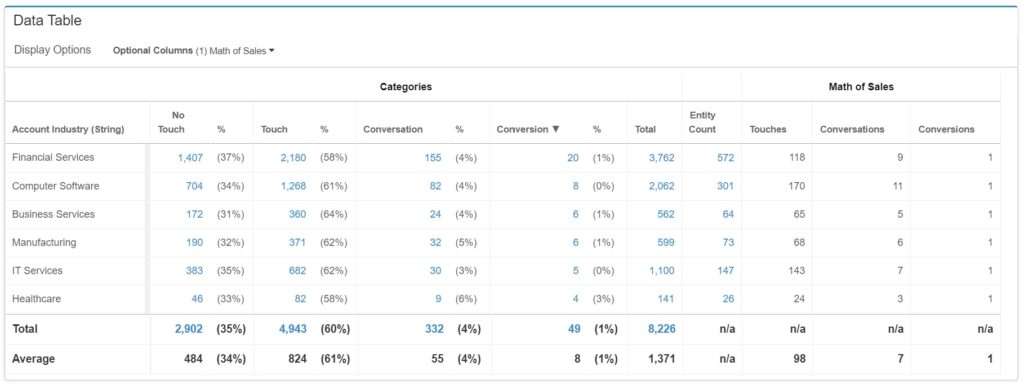
Here’s an example Math of Sales report based on industry. As you can see, Financial Services is the industry where most of the efforts are focused. It has the most total touches, conversations, and conversions. However, when you look deeper, this may not be the most efficient industry for the team. Look at the Healthcare industry. While it has the least number of touches and conversations, it has the highest percentage of conversations and the highest conversion percentage of any industry.
So, for teams only tracking the total number of touches, conversations and conversions, it would be obvious to focus heavily on Financial Services. However, this team may be more effective in the Healthcare industry. If the team were to shift focus onto Healthcare and continue to have 3% on conversions at the same volume as the Financial Services industry, there would be 113 deals closed, not only 20. Where would you focus your team’s efforts?
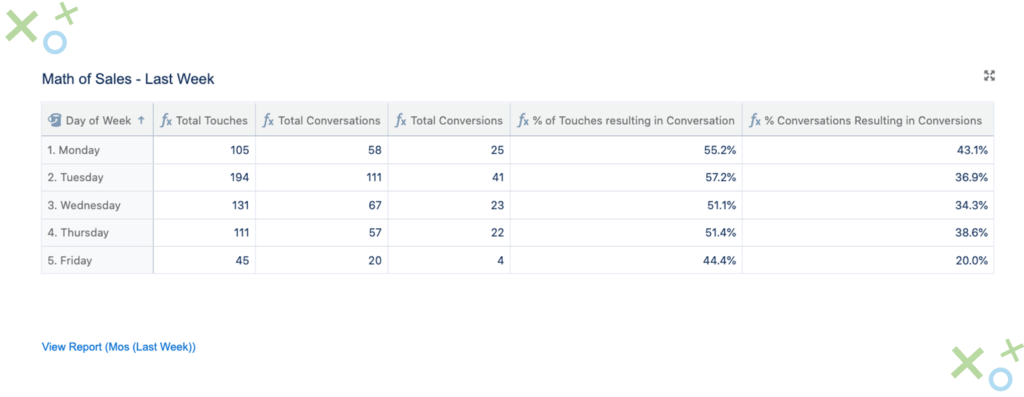
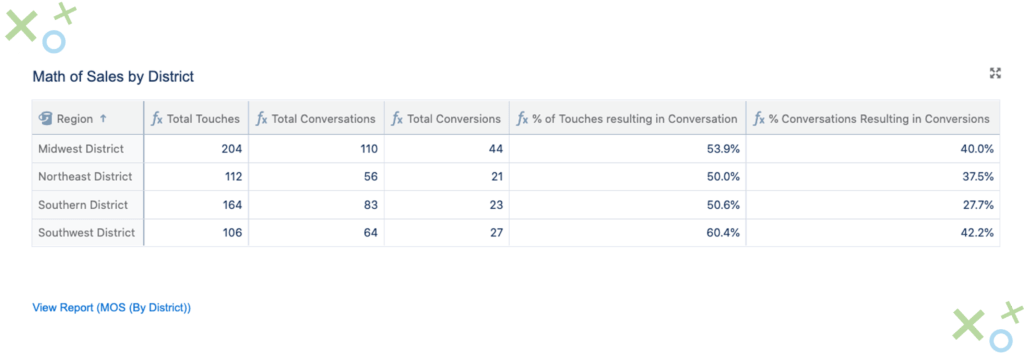
Here’s some more examples of Math of Sales report types. See if you can figure out where efforts should be focused based on the areas truly driving the most efficient results.
Summary
As you can see, the idea of prospecting metrics is vast and confusing. There’s hundreds of different metrics you can track and many different ways to visualize them. Even after you find ones you like, they may not be helping drive the best practices moving forward. This is a problem Salesvue saw and solved.
By leveraging all your sales engagement efforts within Salesforce, you eliminate any discrepancies in reports in different platforms. Also, you gain access to building your reports baked off of Salesforce objects. So, when looking at reports that truly break down what’s going on in your prospecting efforts, you gain access to insights that will help give your team life and close more deals.
Subscribe to Funnel Vision
Get the latest and greatest right in your inbox