Working in sales is made much easier with tools such as a sales dashboard. A sales dashboard gives you insight into key factors in the sales process, such as performance indicators. Using a tool like a sales dashboard can help you organize and present a large amount of information in a simple manner. With a seemingly overwhelming amount of sales data being put into a sales system every day, a dashboard can help make sense of this data. This in turn makes your life as a sales professional easier. Here is what to keep in mind when creating a great sales dashboard:
USE RELEVANT DATA
A dashboard is only as good as the data that goes into it. Having access to real-time data is a crucial part of a sales dashboard. Some of this sales data could include which representatives are close to closing a deal or seeing which forecasts are not going to be met. Being able to visualize the sales cycle in one place is a great help to those working in sales. However, making sure your data is relevant is very important for a dashboard. Utilizing relevant data on a dashboard is a great way to dive deeper into trends and measure sales performance.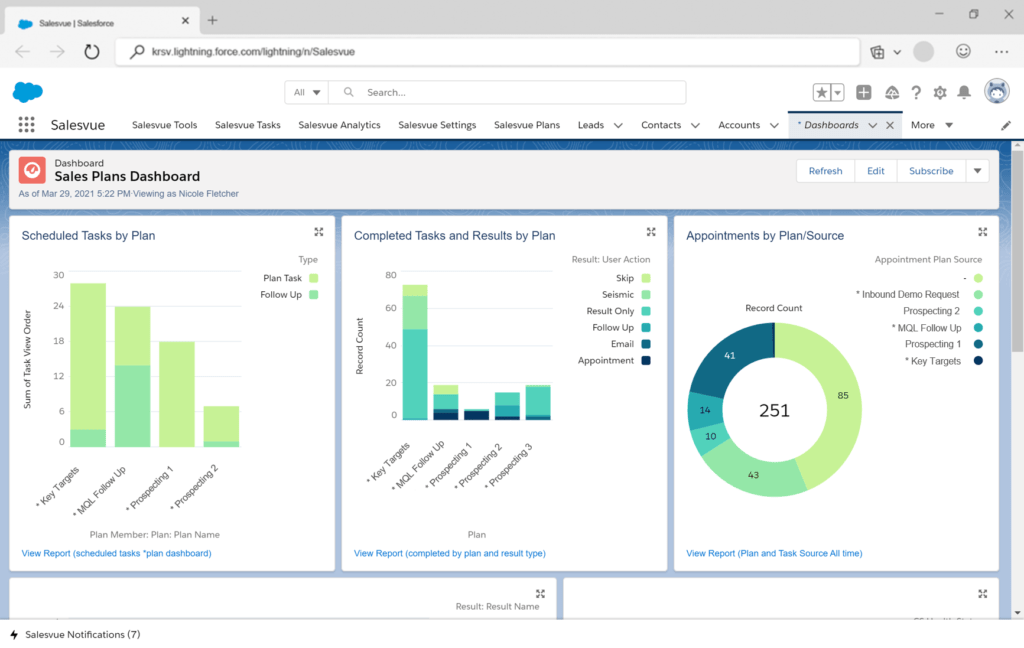
USE ACTIONABLE INSIGHTS
While the term “actionable insights” may be becoming a buzzword that managers and sales reps love to throw around, they can be the difference between a good year and a great year. Actionable insights take the data and information collected and turn them into something usable and more valuable for you. By including and highlighting actionable insights on your sales dashboard, your management teams will be able to see trends that go beyond basic data. For example, actionable insights can help make your cadences more efficient. If after 60 days your reports show clients are not having conversations after Step 6 in a 10-step plan, then you can change the cadence to end after Step 7. This then makes your workflow more efficient.KEEP IT ORGANIZED
Trying to make sense of sales data from only a single day can be complicated, let alone an entire week, month, or quarter. Therefore, organizing your sales dashboard is so important. Keeping the dashboard clutter free and easy to read will help keep the data grouped logically. By grouping data based on product, prospect, recency, campaign, or more, it is easier to make sense of. This makes your dashboard more useful. The space on your screen is limited and valuable, so keeping an organized dashboard is key.KNOW YOUR METRICS
There are a few things to consider before you build a sales dashboard. Answering questions such as what your dashboard should convey to different audiences depending what department they work in or figuring out what metrics you want highlighted helps build a dashboard that is made to help you succeed. Once you figure this out, make sure to include information that:- Is relevant and timely
- Helps the reader draw conclusions
- Reinforces your metrics
USE COMPELLING VISUALS
One fault of sales leaders is getting carried away with flashy design and technical templates. While these sales reports may look visually appealing, they have lost their value if the data gets lost in the show. It is important to use visuals that aid in the sales cycle, not hamper it. A simple graph that highlights spikes or lulls in activity can be just as, if not more effective than a graph that compares seven metrics and jumbles data. On top of this, it can be effective to keep your designs and layouts consistent. This makes your sales reports easier to read and understand.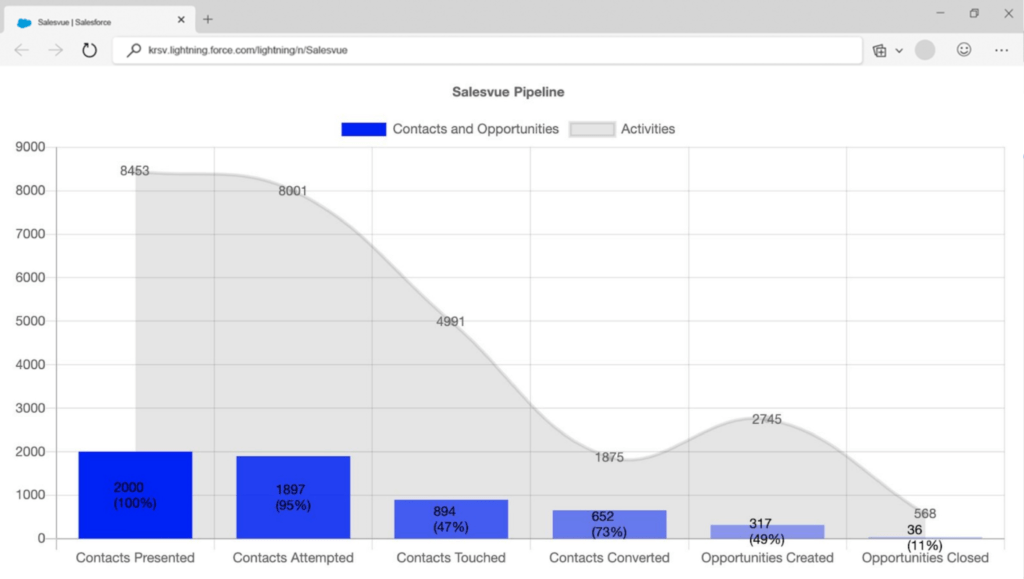
HAVE SITUATION AWARENESS
Your dashboard must have data that tells you what is going on right now. Having data that is up to date and knowing how it is affecting you currently and how it may impact you in the future is an undeniable benefit of a dashboard. Both positive and negative information must be current. Knowing if a sales rep is close to closing a deal is just as important as seeing if another is lagging on their quota. A sales dashboard will help you both celebrate and close out that potential deal while also helping the other rep get back on track.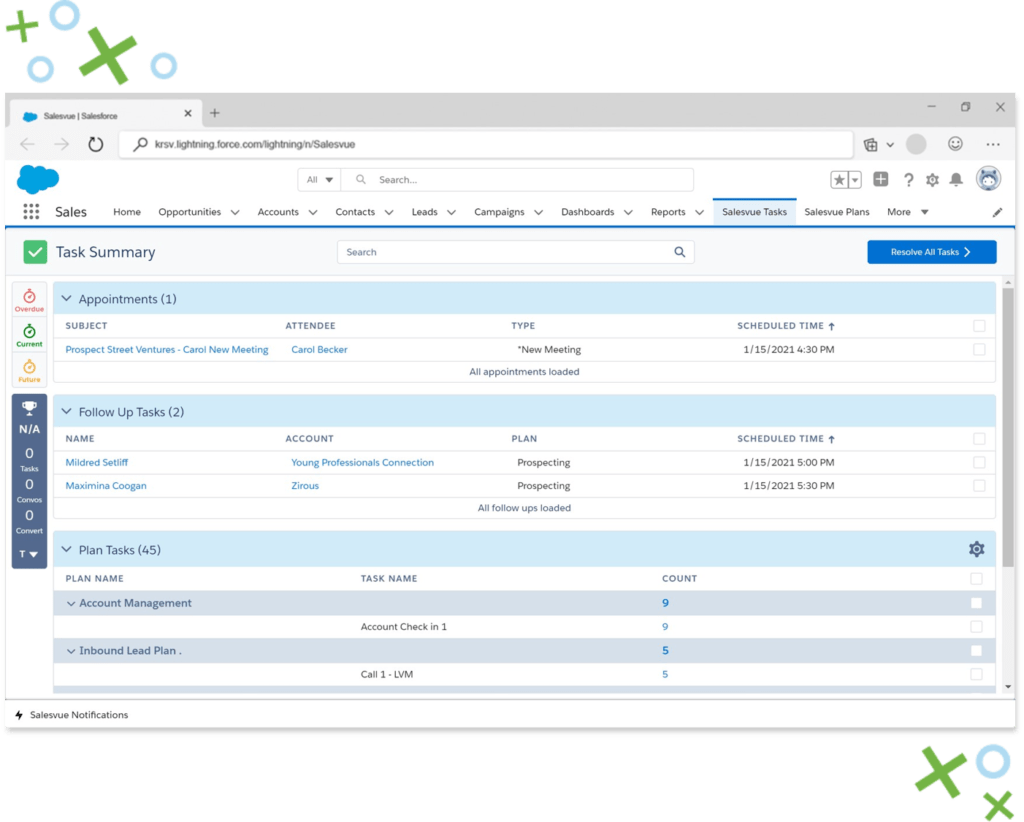 Salesvue’s dashboard gives you everything you need, in one place. The home screen gives you easy access to overdue, upcoming and current activities, from appointment resolutions and follow-ups to campaign activities. You can stay up to date and sort tasks on the basis of priority. You can also access the total activities report for a snapshot on where your reps stand with their leads, and dig deeper into activity reports by filtering those reports by campaign, date and sales rep.
What your Sales Dashboard Should Tell You
VALUE OF THE PIPELINE
Every sales professional knows the value of the pipeline. It is not enough to only set targets and forecasts. You must also know how you are faring right now in the sales process. Your dashboard should give you an idea on how much value is in your pipeline on any given day. Other valuable information can include how many leads have been touched, how many have converted, and which sales activities are overdue or coming up.INEFFICIENCIES AND BEST PRACTICES
Gauging if something is going wrong early in your pipeline can provide lots of value. Your dashboard can help catch if things are going wrong with the success of a campaign, an individual sales rep, or a method of functioning among many other things. Identifying what is going wrong can help alleviate the pain of not knowing what the problem is and can help you get back on the right track to getting more conversions.INSIGHTS INTO PRODUCTIVITY AND SUCCESS
Setting specific metrics can help you measure productivity and success. Your dashboard should display how your sales reps and business are faring based on these factors. Only seeing metrics, performance indicators, and conversions without also getting details about the causes for them means your dashboard is not giving you enough. Conversions are great, but if your conversion rate is extremely low, that is an issue. With a sales dashboard, you will be able to see this.THE SALESVUE ADVANTAGE
Salesvue is a sales engagement platform that helps managers, sales representatives and marketers keep track of sales interactions and processes. With Salesvue, each activity has it’s own separate dashboard- which means you can directly go to the task you wish to review. Sort through data based on total activities, daily activity, pending activities, overdue team activity and recently created activity. Once you access the dashboard of your choice, you can refine search results further, based on campaign, sales representative or specialized search.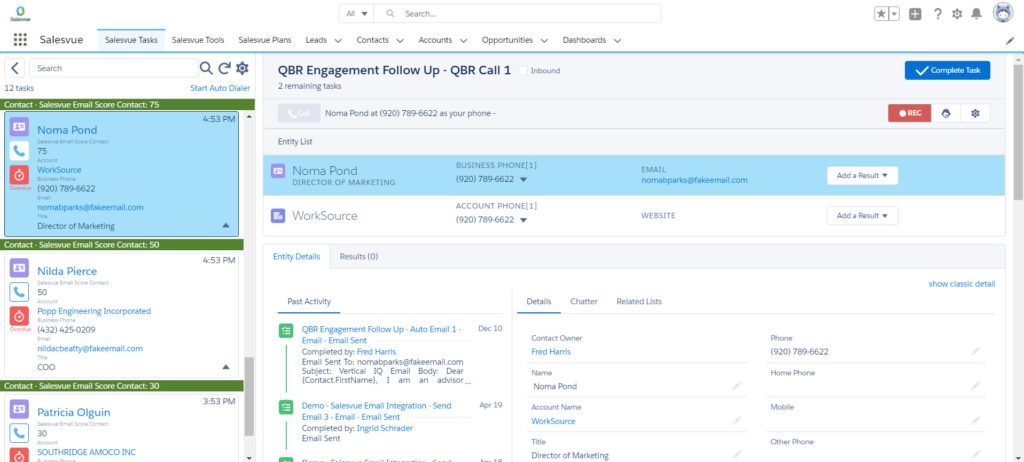 Our software allows you to easily track everything related to the sales process- meetings, proposals, phone calls and outcomes. Searches can be narrowed down to look at success rate. These can be viewed by sales rep, campaign, time of day, and day of the week. You can see, at a glance where critical calls, referrals, appointments and meetings take place. You can also pinpoint exactly where your sales representatives are facing trouble and where they are accelerating. Save time and sell more with automated follow-ups and useful reports.
Subscribe to Funnel Vision
Get the latest and greatest right in your inbox