
Salesforce defines a sales pipeline as a “visual representation of where prospects are in your sales process.” With information about your pipeline, you can make sales predictions, identify strengths and weaknesses, and improve your sales operations. A sales pipeline report can help you determine how much business you can expect your sales reps to close in a given timeframe. In this post, we’ll help you see how you can take full advantage of Salesforce’s data coupled with a Salesforce-native sales engagement platform, using the Ultimate Sales Pipeline Report for Salesforce users.
What is the Ultimate Sales Pipeline Report?
It’s a Salesvue report that combines Salesforce’s Opportunity data with Salesvue’s prospecting data from the beginning of your sales cycle all the way to Closed Won or Lost. By harnessing the power of Salesforce and Salesvue data together, this report helps you identify which activities drive results and which don’t, and where prospects may be lost in the pipeline. You’ll get insight into the correlation between activities and conversions all the way from prospecting activities to Leads to Opportunities to Closed Won or Lost.What’s on the Ultimate Sales Pipeline Report?
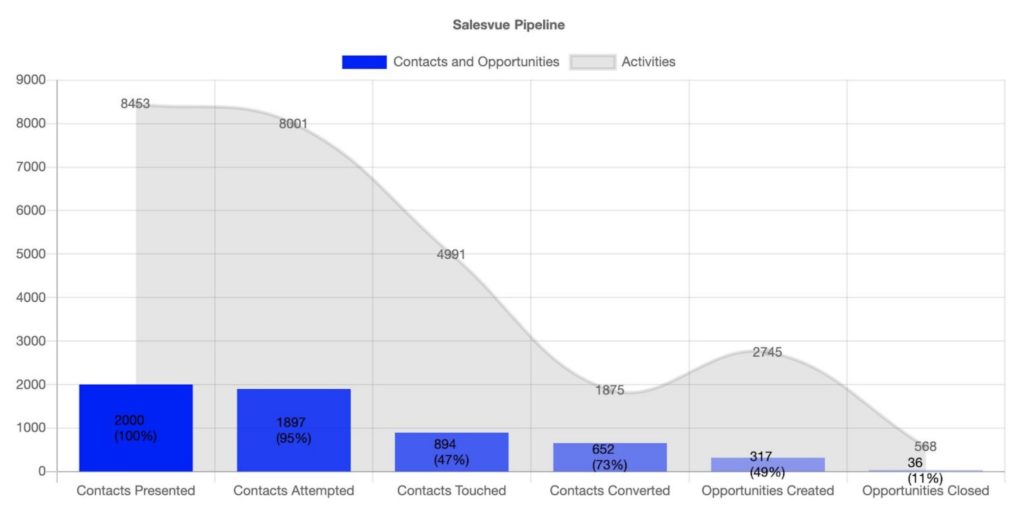 The labels on the horizontal axis in the report above represent each phase in the sales pipeline. Here is what each phase is depicting:
- Contacts Presented is the total number of scheduled activities, although some of these activities may not be resolved, resulting in fewer Contacts Attempted.
- Contacts Touched shows the number of activities for which at least one of the selected results was configured as a Touch. In our case, we consider a phone call to be a touch, but not an email.
- Contacts Converted is the number of activities for which at least one of the selected results was configured as a Conversion.
- Opportunities Created shows the total number of activities completed for the Opportunities that were created.
- Opportunities Closed-Won counts the total number of activities completed for the Opportunities that were closed-won.
How might you interpret the Ultimate Sales Pipeline Report?
Looking at the report image above, the gray area represents activities and the colored bars represent Contacts or Opportunities. If the gray area is much higher than your colored bars, you are wasting a lot of effort on activity that isn’t translating into great results. Let’s take a look at what that might be happening in those cases when there is a large disparity or your conversion rates are lower than you’d hope.- Contacts Attempted are low. You may have started with a number of lead sources to complete sales activities in this phase. For example, you may have built or bought a list, or you may have captured lead information from people who interacted with your website. If your lists were not good (containing invalid data) or didn’t capture your ideal customers, you may have had a lot of activity that didn’t result in many Contacts Attempted. It could also be simply that you have many campaign activities still to be completed.
- Contacts Touched are low compared to activities. Email is a no-touch contact in Salesvue because a phone call is what generates conversations. In this case, you are getting fewer conversations. You can ask for a phone number in content download forms on your website to increase the number of touches and conversations you can generate. You’ll also want to ensure reps are making all their calls, or you can increase the number of phone calls required in your cadence. Or, add a phone call in follow-up cadences.
- Contacts Converted are low compared to activities. Contact Converted means that of all the people on your list, these are the ones that have converted from a Lead to a Contact. In this situation, you should check your sales reps’ timeliness of follow up and the aggressiveness of your cadence. You may have just given up too soon and have too short of a cadence or tasks spaced too far apart.
- Opportunities Created are low compared to activities. Perhaps your marketing content is interesting, but they aren’t interested in your product or service; Or, your sales reps aren’t following the process and simply aren’t selling your products and services well.
- Opportunities Closed are low compared to activities. You have determined that the prospect is a definite possibility and good fit for you. In this case, your sales reps may not be aggressive or responsive enough. Your value proposition may not be good enough. Or, you don’t have a compelling differentiation from your competition. Or, perhaps, you have a long sales cycle, and your reps just haven’t closed the deal yet.
Subscribe to Funnel Vision
Get the latest and greatest right in your inbox