You couldn’t coach an effective football game without watching film and you wouldn’t be a meteorologist without checking the weather maps. So, why be a sales leader without the best sales enablement KPIs? By not utilizing the best key performance indicators for your team, not only are you doing your sellers a disservice, but you’re setting them up for failure. While there are general KPIs that everyone knows, you must remember to use those that apply best to your team and goals. To know what’s best, first start by assessing your goals for sales enablement.
Goals of Sales Enablement
Sales enablement is a key tool for leaders in the field. By staying on top of your sales enablement practices and fine tuning these tools for your team, you’re already one step ahead of the competition. Sales enablement, for those who may not know, is the tools and processes you provide to your team to help the sales process run smoothly. An important consideration for sales enablement is your sales enablement framework.
Sales Enablement Framework
This framework is what helps align different technology in your sales process. Including everything from the content being pushed out to the sales training new employees go through, the sales enablement framework is key to your teams’ success. However, the important part of the framework in this conversation is the measurement aspect.
Driving Revenue
The measurement part of the framework is where your KPIs live. This is where your data is tracked, KPIs are measured, and actionable insights are created. It’s important that everything in this area goes towards helping your team drive revenue. There are many things covered by this including making sure you’re targeting the right audience, having the best conversations to generate conversations, and having the best working content. KPIs can help point you in the right direction for all these and in turn, the right KPIs for these issues will help drive revenue.
Most Important Sales Enablement KPIs
Now that the true importance and use of KPIs is shown, let’s dig more into some of the examples laid out above.
Targeting the Right People
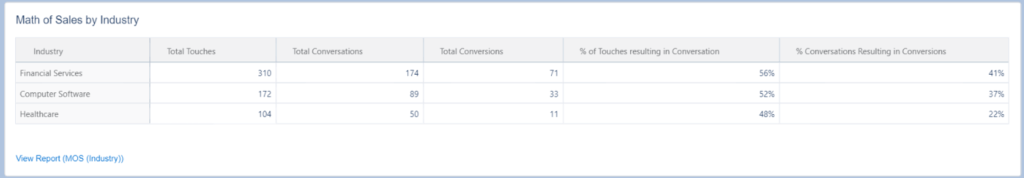
Targeting the wrong people in your sales efforts is like trying to drive from New York to LA without a map. Yes, you may make the occasional right turn, but there will be a lot of mistakes and inefficiencies in the way. This is why it’s vital to know who to target. Using reports, like Math of Sales, can help show not only what the best industries to target are, but what job function yields the best results as well. For example, using Math of Sales can highlight which industry takes the least amount of communications to generate a conversation. How valuable would it be for your team if you could know which industries to avoid after knowing efforts trying to reach it are going to waste?
Messaging and Content
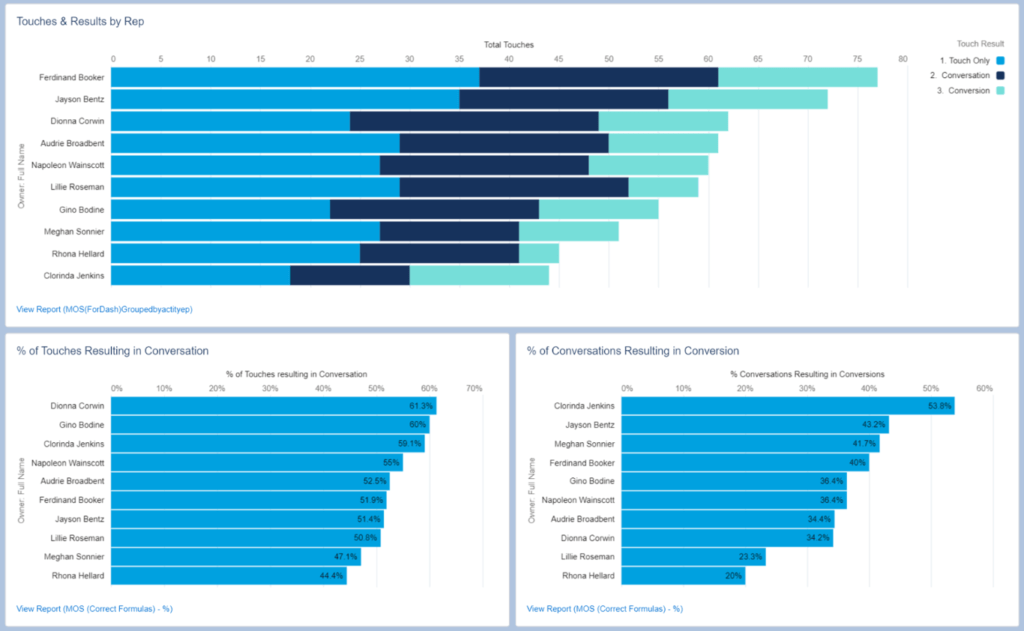
If you want to look more specific than a general industry, you can also break down seller by seller which are reaching prospects with the most efficiency. How could it help your efficiency knowing how many touches it took each seller to land a conversation or conversion. Imagine knowing which of your sellers can land a conversion in less than five touches, versus the 13 it may take another seller. Think about how that could change your training, planning, and overall efforts.
Right Processes and Playbook
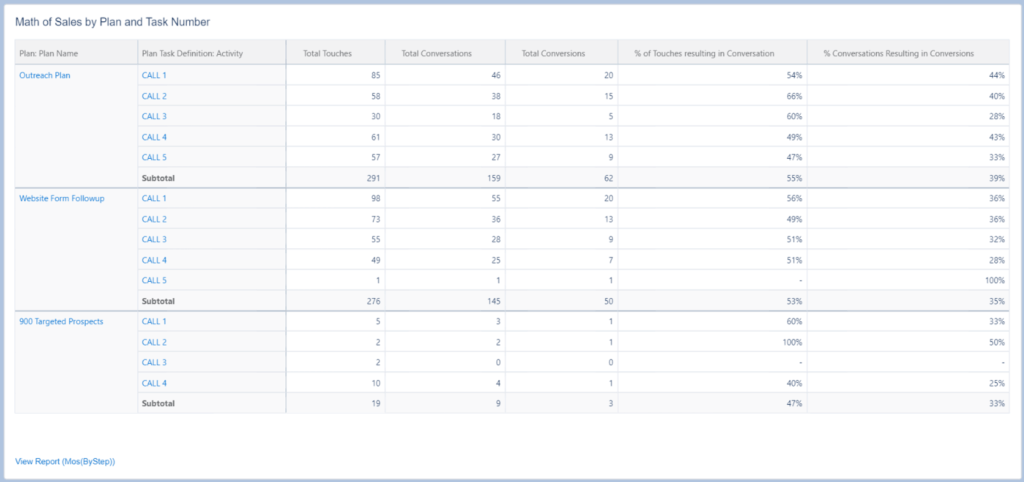
If you want to take the sellers out of the equation, you can even look into how well your processes are performing. Using Math of Sales, you can break down each plan into their tasks and see metrics into how each is performing. For example, you could look at an outbound prospecting plan with three emails and two calls as its touches. If you could see that after the second call you get 80% less engagement and conversations, why bother wasting time on it? Or, on the flip side, if the second call had wild success, you could replicate this step across different plans.
Training and Processes
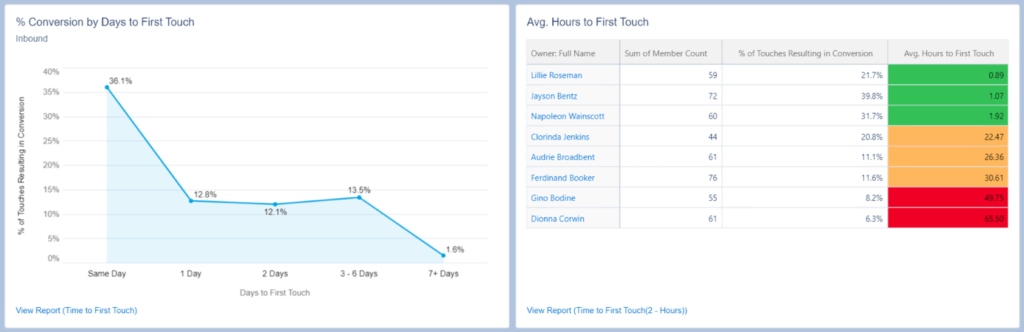
The final metric in this system that can be highlighted is again looking at specific sellers. This time you can break down the time to first touch. Basically, this report shows the average hours or time it takes for a seller to follow up with an inbound lead. Not only does this have a big impact and correlation with conversion rates, but it could also lead to your best sellers giving some tips and tricks to those slacking behind.
Summary
KPIs can be a sales leader’s best friend, but also very overwhelming at the same time. This is why finding a system that caters to providing you with the most important ones can have a great impact on your team. With Salesvue, you will gain a valuable look into the sales enablement KPIs that truly matter. By using reports, like Math of Sales, Salesvue can help show the most important and relevant KPIs to help your team’s efficiency and effectiveness.
Subscribe to Funnel Vision
Get the latest and greatest right in your inbox