
When it comes to analyzing and gauging success of sales teams, many sales managers rely simply on whether or not they hit their goal for the month or quarter. Some use a mix of reports that often can’t give up-to-the-minute rep activity data, so decisions can’t be made in real-time. In this post, we will show you the five best Salesforce reports for sales managers that let you become agile and make adjustments that will move the needle in a most timely manner.
SALES REP ACTIVITY REPORT (Math of Sales)
Rep activity numbers can be a deceiving metric when judging success for a sales rep. Here’s an example of why that is. Let’s say you have the reps shown below. Which rep is the highest performing? You might think it’s Rebecca or Zachary because they logged the most touches and achieved the highest number of conversions. If quantity is the measure of success, then you’d be correct. However, if quality and efficiency is how you measure success, this Math of Sales report will give you a clearer picture. This report shows how many activities it takes a sales rep to have a conversation and how many conversations it takes to convert. Therefore, Michael Smith would be the best performing rep, since he only has to make 3 touches to get a conversation, and he converts on almost every conversation, whereas the other reps take 5 or 6 conversations to get a conversion.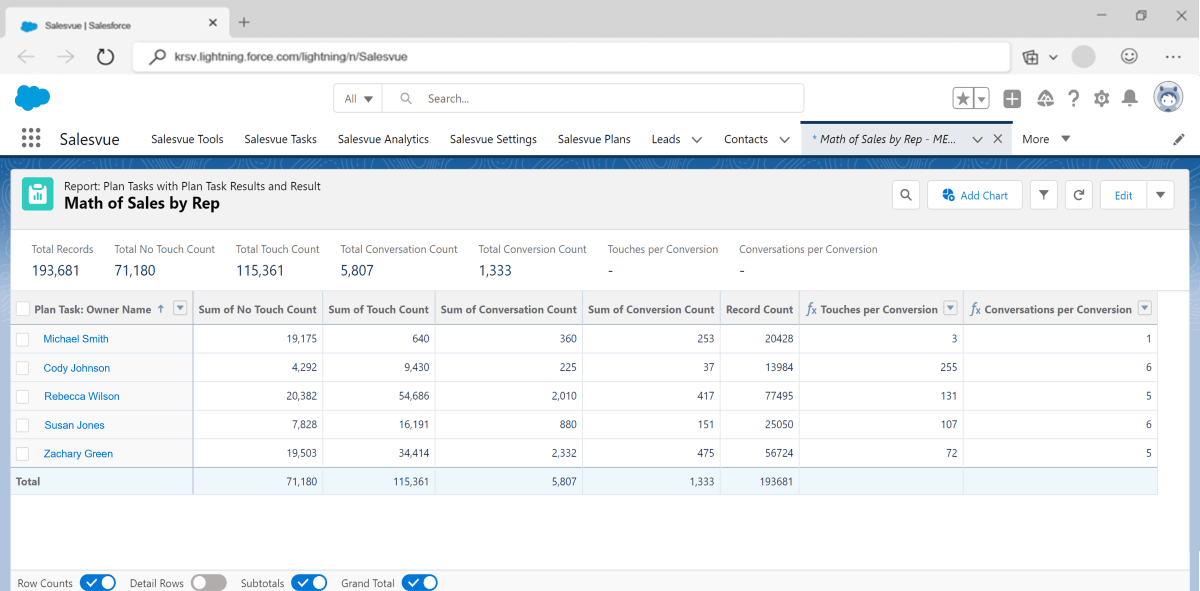 When you look at how many touches it takes Rebecca to get to a conversation, she is not the most efficient. While Rebecca and Michael both get 1 conversion from every 5 conversations, Michael gets those conversations (5) in half the touches. Looking at the report, Michael is the best performing rep across the board. Now, with this data on hand, a sales manager should then explore the answers to questions like, “What is Michael doing that is allowing him to convert at a higher rate? Is it the leads he is getting? Is it the messages he sends? Is it the number of times he follows up? Is it the job role of the people he is contacting?”
After determining what is working for Michael, the sales manager can establish best practices based on what this most effective rep is doing. The sales manager may also choose to implement an automated workflow plan for the rest of the team based on the sequence he is doing, so everyone is engaging leads in a similar fashion.
When you look at how many touches it takes Rebecca to get to a conversation, she is not the most efficient. While Rebecca and Michael both get 1 conversion from every 5 conversations, Michael gets those conversations (5) in half the touches. Looking at the report, Michael is the best performing rep across the board. Now, with this data on hand, a sales manager should then explore the answers to questions like, “What is Michael doing that is allowing him to convert at a higher rate? Is it the leads he is getting? Is it the messages he sends? Is it the number of times he follows up? Is it the job role of the people he is contacting?”
After determining what is working for Michael, the sales manager can establish best practices based on what this most effective rep is doing. The sales manager may also choose to implement an automated workflow plan for the rest of the team based on the sequence he is doing, so everyone is engaging leads in a similar fashion.
PROSPECTING SUCCESS REPORT
How much time do you spend with a prospect to get a conversion? Where and when are you getting your wins? When a sales manager is onboarding or coaching the team, how many times they encourage reps to follow up can make a big difference. Looking at the Prospecting Success Report, you can see how professional persistence pays off. Let’s take the same three reps from the previous example. Let’s say Susan only follows up with a lead three times before moving them to a “Not Interested” status. Michael stops at five follow ups, but Rebecca continues to follow up with leads eight to twelve times before considering it a bad lead.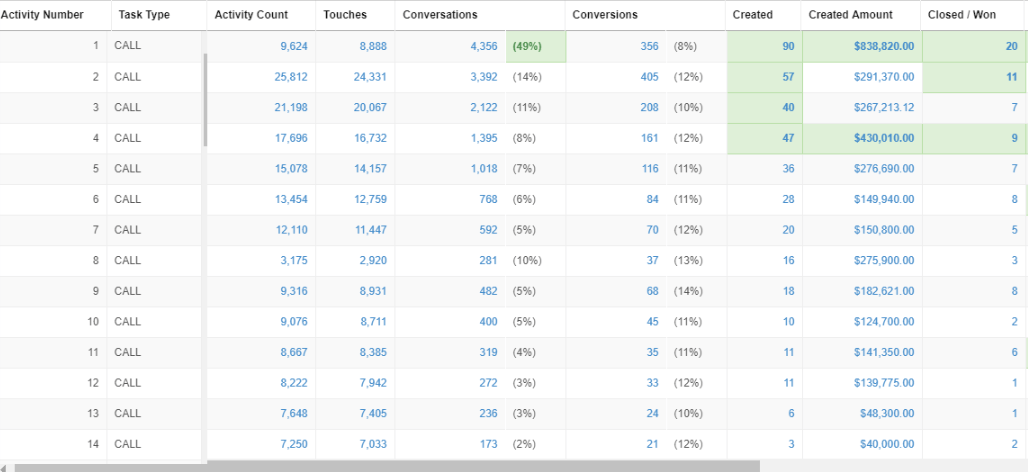 The Success Report shows when activities are converting. As you can see in the report above, this explains why Rebecca is more successful and converting more. At calls eight and nine, the conversion rate is respectively thirteen and fourteen percent. The persistent rep often ends up getting the conversions the other reps don’t. This report is handy for sales managers who want to make the case for reps to follow up more times with leads.
MARKETING LEAD SOURCE (Math of Sales)
The Marketing Lead Source report is equally as important to marketing as it is to sales managers and really helps bridge the two departments. When determining which leads reps should be pursuing, it is important to determine which lead sources are producing the highest quality leads. The Marketing Lead Source Report shows the rate at which lead sources are converting. In the report below, let's compare Organic Search and Google Ads as lead sources. Both generated 16 leads, so which one is the best? A closer look reveals that for Organic Search, it takes 9 touches to get a conversion and 2 conversations to get a conversion. However, leads from Google Ads only need 5 touches to convert, and about every 1 conversations leads to a conversion. Therefore, it is rather safe to assume that leads generated from Google Ads are higher quality leads and are more likely to convert to a sale.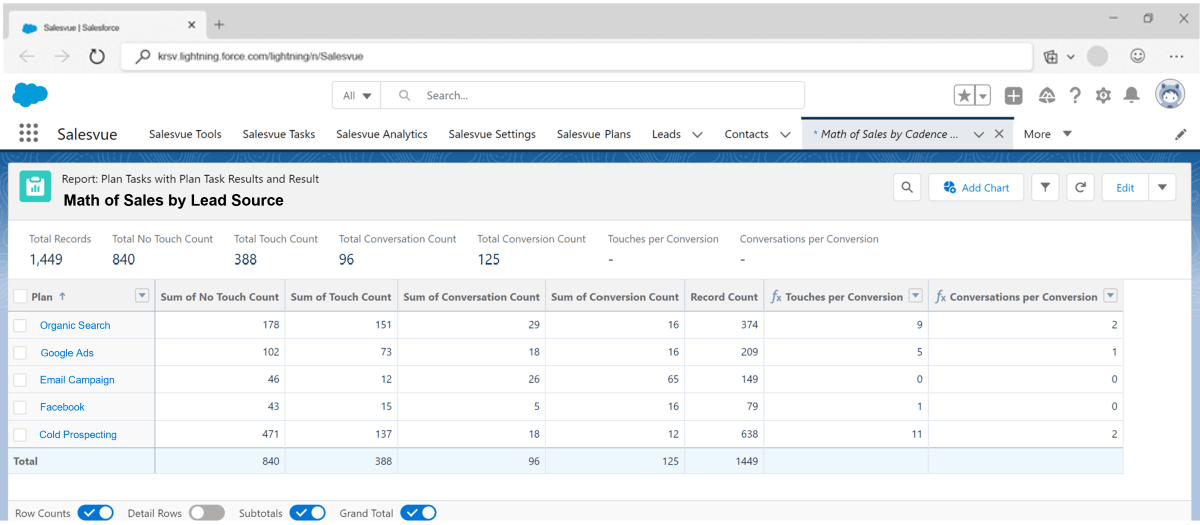 With this information, the sales manager can make sure their reps prioritize contacting and following up with leads from events based on actual data, not guesswork. Marketing may also then choose to allocate a larger part of their budget to producing more events knowing that they generate higher quality leads.
CONVERSATION RECENCY REPORT
Because your customers and prospects are often in different phases of their customer journey, consistent and timely communication can be difficult for your sales reps. The Conversation Recency Report provides sales managers a view of how the organization is performing against their goals for maintaining a consistent connection in the form of an actual conversation with their prospects and customers. The Conversation Recency Report allows you to compare performance for different segments of prospects or customers to identify areas needing more consistent and improved communication.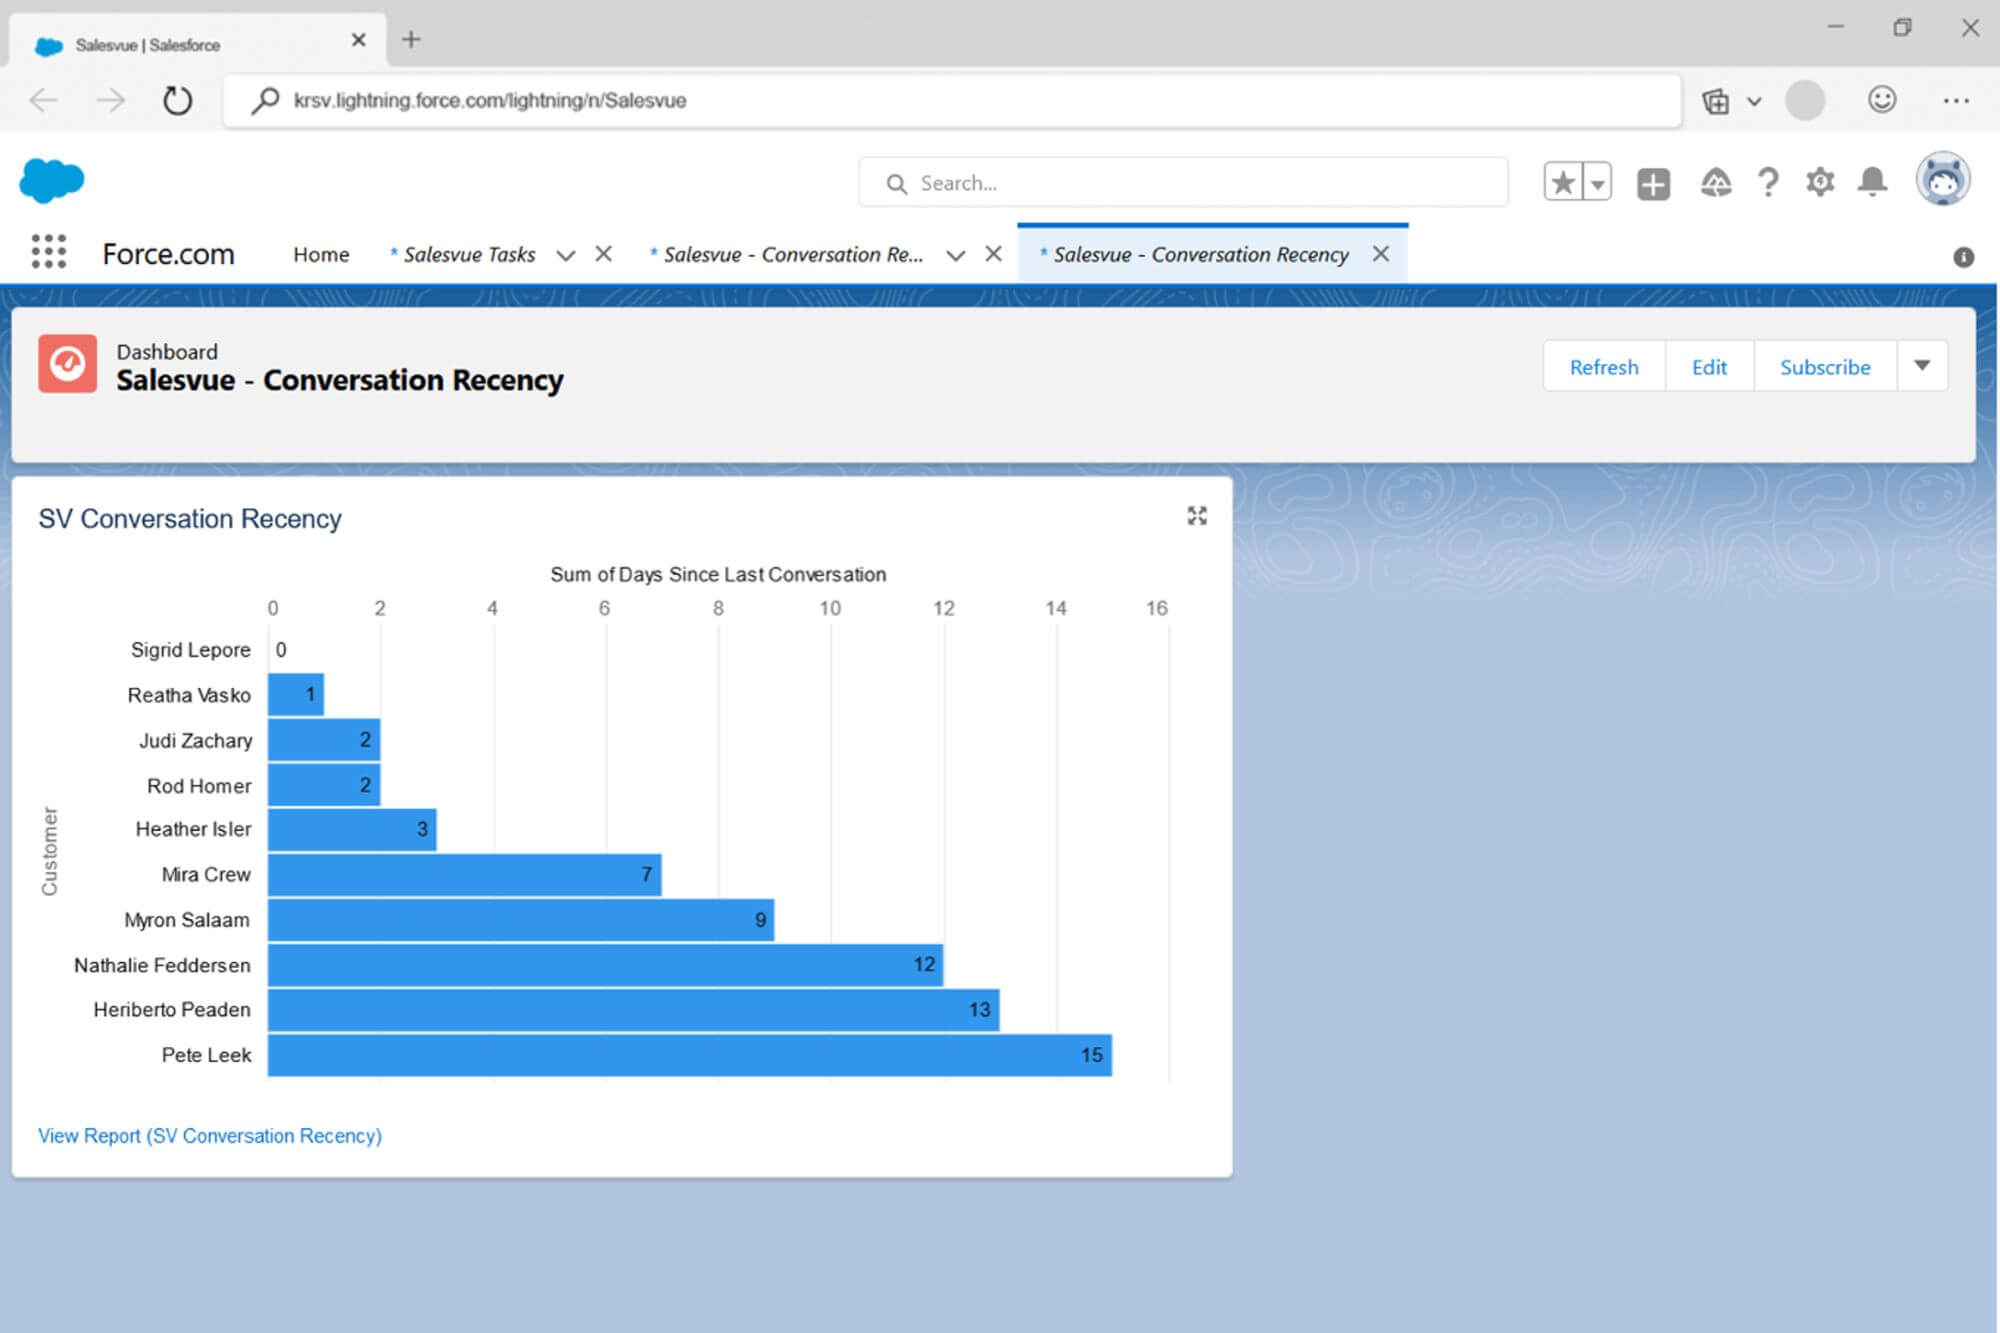 Looking at the report above, conversations with SMB Accounts are less consistent than the other customer segments with a lot of conversations occurring sporadically across a long period of time. Strategic Accounts are contacted within a much tighter timeframe. Using this information, the sales manager should look at sales cycles and workflows to see if there are opportunities to optimize the reps’ cadences and follow-up schedules.
Because Salesvue is native to Salesforce, you can pull these and many other reports without ever leaving your Salesforce instance. Salesvue can provide companies with these insightful, real-time reports because of our proprietary Math of Sales™ formula. With Salesvue’s Math of Sales™ formula, Sales Managers are able to break down data into a very easy-to-read report based on how many activities it takes to get conversations and how many conversations it takes to get a conversion. By breaking it down into a simple formulaic approach, getting actionable insights based on reliable data becomes a breeze.
Looking at the report above, conversations with SMB Accounts are less consistent than the other customer segments with a lot of conversations occurring sporadically across a long period of time. Strategic Accounts are contacted within a much tighter timeframe. Using this information, the sales manager should look at sales cycles and workflows to see if there are opportunities to optimize the reps’ cadences and follow-up schedules.
Because Salesvue is native to Salesforce, you can pull these and many other reports without ever leaving your Salesforce instance. Salesvue can provide companies with these insightful, real-time reports because of our proprietary Math of Sales™ formula. With Salesvue’s Math of Sales™ formula, Sales Managers are able to break down data into a very easy-to-read report based on how many activities it takes to get conversations and how many conversations it takes to get a conversion. By breaking it down into a simple formulaic approach, getting actionable insights based on reliable data becomes a breeze.
Subscribe to Funnel Vision
Get the latest and greatest right in your inbox